
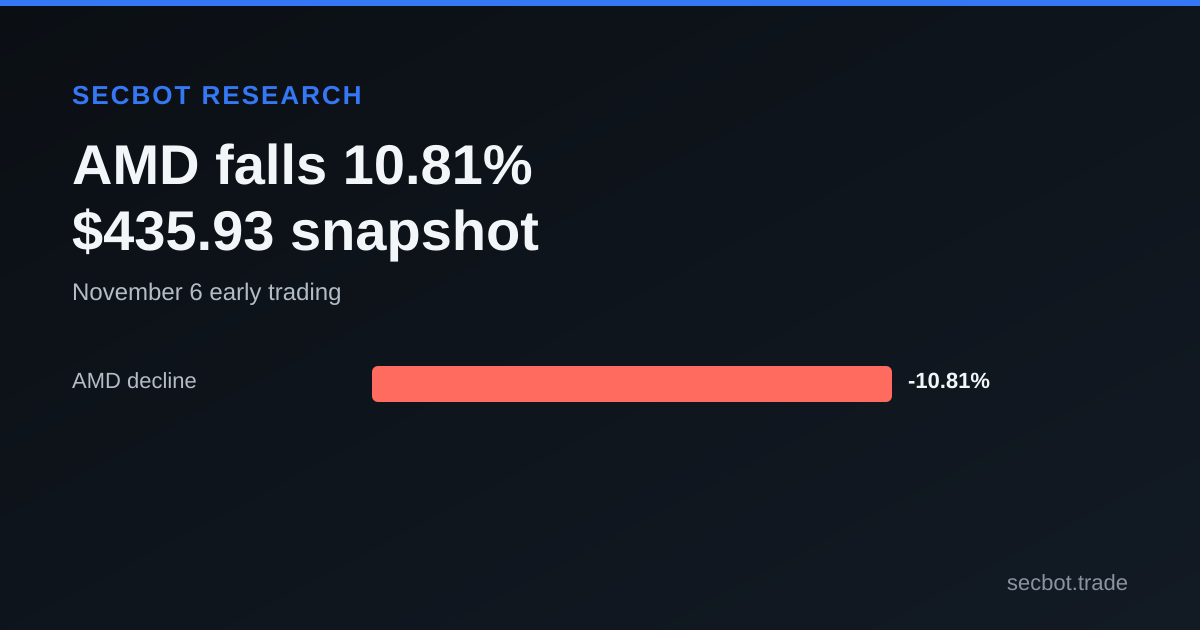
AMD's early session decline
AMD was down 10.81% at $435.93 in the SecBot market snapshot timestamped 2026-11-06T13:02:46.508Z. Its recorded intraday range was $402.10 to $456.20. The move made AMD the largest decline among the individual stocks listed in the retrieved market-movers results at that time; the next largest single-stock decline shown was TSLA at 10.77%, based on a quote timestamped 2026-11-05T21:00:01.000Z. That timestamp difference matters: the market-movers list combined different observation times, so the comparison is a snapshot of the returned rows, not a synchronized same-minute ranking.
The AMD quote is a striking session reading, but the available records do not identify a specific news event as its cause. The local events query returned no rows for the ten-day window, and the press-release results supplied no November 6 item. AMD's latest earnings release record and a cluster of analyst actions predate the session. They help describe what was already in the data before the decline, but they cannot establish why the stock was lower.
The price reading and its limits
The current quote result reports AMD at $435.93, with a high of $456.20 and a low of $402.10. It shows a 10.81263554155243% change, which market movers displays as a 10.81263554155243% negative session change. The feed timestamp is 2026-11-06T13:02:46.508Z, before the publication cutoff for this post. This is an intraday observation, not a closing price. The quote's session field is listed as "unknown," so the data does not make a more specific regular-session or extended-hours classification.
The last daily candle in the historical price result is dated 2026-11-05. It shows a close of $404.3999938964844, with a daily high of $456.20001220703125 and a low of $402.1000061035156. The separate current quote reports previousClose at $488.78. Those two records do not align on the prior-close reference. Rather than blending the values or inferring an explanation, this report treats the change percentage as the value supplied by the current quote and market-movers results. The discrepancy is a reason to retain the feed's timestamp and source context when citing the move.
The range itself conveys that the stock moved across a broad interval during the recorded session, but it does not reveal when the high or low occurred. Nor does the feed show the order flow behind the change. Price data describes the observed market, not the participants or their reasons.
Recent reported results were stronger than consensus
AMD's latest analyzed press release was categorized as earnings and created on 2026-11-03. It reports Q3 2026 revenue of $13.4B, up 45% year over year, compared with consensus of $13.09B. The data summary says Data Center segment revenue nearly doubled to $8.5B. Non-GAAP EPS was $2.09 against consensus of $1.94, and the report gives a 7.7% beat. These are the figures in the earnings record, not a separate calculation in this article.
That release summary supplies a useful recent business-performance reference point. It does not mean the market decline is inconsistent with the results or that the results caused the decline. Earnings cover a reported quarter and include both company results and comparisons with expectations. A share-price snapshot reflects trading at a particular time. The available data does not provide a detailed breakdown of the orders or the reasons behind individual market decisions.
The same release record labels its sentiment bullish and assigns an impact score of 7. Those fields are SecBot's analysis of the announcement, not company guidance about the stock or a promise of future performance. The record's Q3 revenue and earnings figures can be checked separately from its sentiment label. Keeping those distinctions clear avoids treating an analytical classification as an explanation for a later price change.
Analysts had revised targets in both directions
Several AMD analyst entries arrived on 2026-11-04. UBS maintained a Buy rating while lowering its price target from $730 to $700. Wells Fargo maintained Overweight and lowered its target from $700 to $650. Mizuho maintained Outperform and lowered its target from $705 to $610. Those rows register reductions in target levels without a rating downgrade in the same action.
Other firms' target changes went the other direction. JP Morgan maintained Neutral and raised its target from $550 to $575. Piper Sandler maintained Overweight and raised its target from $600 to $650. DA Davidson maintained Buy and raised its target from $550 to $600. The actions show mixed adjustments within the same day's records, not a unanimous change in analyst view.
These published targets are firm estimates rather than observed prices, and the analyst records do not say that any one revision drove the trading move. The distinction is important because the stock quote is an actual market observation at its timestamp, while a target is an attributed analyst opinion. No aggregate target or consensus value is needed to see the direction of these individual changes. More analyst rows and the company-specific context are available on SecBot's AMD stock page and AMD analyst page.
What this record does not establish
The available records do not show whether the AMD move followed a particular headline, a broader portfolio adjustment, or company-specific trading. The ten-day events query returned no matching entries, while the press-release query returned two older AMD reports: the November 3 earnings analysis and an October 27 contract-category item. Neither result is a contemporaneous explanation for the November 6 quote. Absence from these local datasets is not proof that no other information existed.
The quote also does not identify whether the change came from retail or institutional participants. No transaction-level evidence in this material connects any named trader to the session. The analyst data is a record of published actions; it is not an order book. Likewise, the earnings summary gives reported financial figures and an estimate comparison, but it does not by itself document how the market interpreted every component.
Historical context should be handled cautiously here. The retrieved daily candle for November 5 and the current quote's previous-close field show different reference prices. This post preserves both readings and avoids calculating an additional day-over-day return from incompatible inputs. Readers can see the source timestamp alongside the live-feed snapshot rather than treating the historical candle as if it were the quote's stated baseline.
The next evidence point
The concrete fact in this snapshot is that AMD stood at $435.93 with a reported 10.81% decline at 2026-11-06T13:02:46.508Z, while its displayed range ran from $402.10 to $456.20. The analyst actions described above were dated 2026-11-04, and the earnings record was created on 2026-11-03. None of those older records supplies a scheduled next catalyst, so this report does not assign one.
Subsequent exchange data can show where the session ultimately closed, while a later company filing or press release may add company-specific information if one appears in the data. The price feed timestamp is the last eligible observation used here. For more SecBot market and company coverage, create an account.