
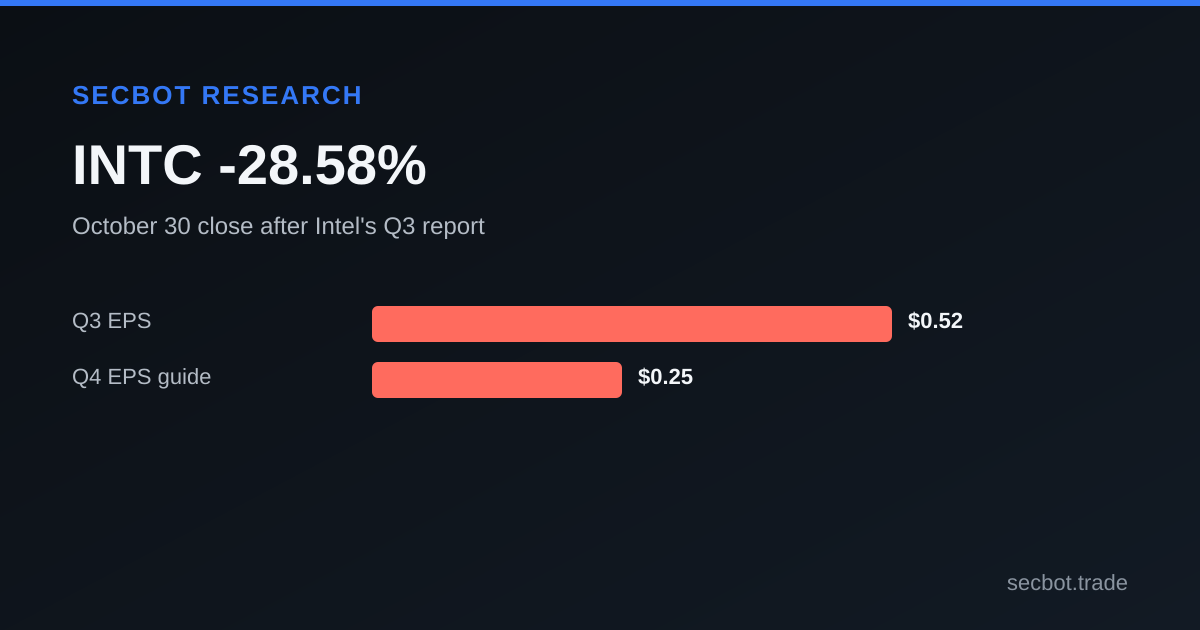
The market move followed an earnings beat
Intel shares closed at $65.76 on October 30. The close-to-close return was -28.58% from the prior session's $92.07 close. The move followed the company's Q3 2026 report, which showed revenue and non-GAAP earnings per share above consensus estimates, alongside a lower Q4 outlook. The price and volume data show how sharply the stock traded during the session, but they do not establish why each market participant acted.
Intel's Form 8-K, filed October 29, included its Q3 earnings release. The report listed Q3 revenue of $16.5 billion against an estimate of $16.49 billion. Non-GAAP EPS was $0.52, compared with an estimate of $0.40. Non-GAAP figures exclude items under the company's adjusted reporting measure; they are distinct from GAAP results. Intel's GAAP EPS was $0.60, down from $0.90 a year earlier, according to the filing analysis.
The contrast in the report is between a quarter that beat or met the listed comparisons and guidance that called for a softer following quarter. That distinction matters in reading the stock move. A result above an estimate describes the reported quarter relative to a benchmark. Guidance concerns the company's stated expectations for a later period. The data here records both facts, but does not prove that guidance alone drove the market's response.
Q4 guidance in context
The filing analysis gave a Q4 revenue range of $15.0 billion to $16.0 billion. Its midpoint, compared with Q3 revenue of $16.5 billion, represents a -6.06% sequential change. The analysis also listed Q4 non-GAAP EPS guidance of $0.25, versus Q3 non-GAAP EPS of $0.52, a -51.92% change.
| Measure | Q3 2026 | Q4 guidance or estimate |
|---|---|---|
| Revenue | $16.5 billion | $15.0 billion to $16.0 billion |
| Non-GAAP EPS | $0.52 | $0.25 |
| Q3 revenue consensus | $16.49 billion | Actual $16.5 billion |
| Q3 non-GAAP EPS consensus | $0.40 | Actual $0.52 |
The reported segment details add texture to the headline totals. Data Center and AI revenue was $7.318 billion, up 78% year over year. Client Computing and Physical AI Group revenue was $8.097 billion, down 5%. Intel Foundry revenue was $6.697 billion, with a reported operating loss of $1.9 billion in the filing analysis. Those segment measures describe different business lines and should not be treated as interchangeable with consolidated revenue.
The same report listed Q4 GAAP gross margin guidance of 37.1%, compared with Q3's 43.0%. Margin is the share of revenue remaining after relevant costs under the specified accounting measure. This forecast adds a profitability measure to the lower revenue and adjusted EPS outlook. The analysis also identified a $23 billion public equity offering completed during Q3 as a consideration for shareholders. The report provides that amount, but it does not quantify the resulting per-share dilution in the share-price data returned here.
A sharp move on exceptional volume
The October 30 daily candle opened at $68.36, reached a high of $68.77 and a low of $63.20, then closed at $65.76. Reported volume was 454,221,300 shares. The prior session closed at $92.07 on volume of 134,168,700. October 30 volume was 3.39 times the prior session's volume, calculated from those two daily observations.
The local month of daily candles gives a wider frame without turning a short sample into a long-term claim. INTC closed at $120.23 on September 30, at $95.53 on October 28, and at $92.07 on October 29. It then ended October 30 at $65.76. The price series shows a decline across the displayed dates, with the final session standing out for its trading volume. It does not include an explanation for individual transactions, nor does the limited chart establish what happens beyond its last observation.
The broader market-movers snapshot for October 30 showed other large-cap names lower as well. AMD was down 10.88%, NVDA was down 4.22%, and QQQ was down 3.47%. INTC's reported decline was substantially larger in that same snapshot. This comparison places the move against other monitored symbols for the session, not against every listed company or a complete semiconductor index. The tool's market-movers universe is limited to symbols its feed monitors.
Analysts changed ratings on October 30
Several analyst actions in SecBot's record were dated October 30. Seaport Global moved its rating from Buy to Neutral. Roth Capital also moved from Buy to Neutral. B of A Securities moved from Buy to Neutral and lowered its published price target from $145 to $100. These are firm opinions, not company guidance, and the rating data does not establish that any one action caused the share-price move.
There were actions in the other direction as well. KGI Securities upgraded INTC from Neutral to Outperform. Evercore ISI Group maintained Outperform while lowering its price target from $133 to $131. Keybanc maintained Overweight. The set of records therefore was not uniform. Each row represents one firm's action as stored, rather than a tally of the entire analyst community or a measure of investor positioning.
The timing is visible in the action records: the listed ratings were graded on October 30, before the end-of-session price observation. That sequence is useful context, but it should not be mistaken for proof of causation. The ratings pages and stock history can be reviewed at SecBot's INTC analyst page and INTC stock page. The earnings filing record is available through SecBot's SEC filings page.
What the available data does not show
The filing and market data do not identify the specific news, orders or expectations behind each trade. A one-session price decline cannot by itself separate the influence of company guidance from analyst opinions or broader market conditions. The market-movers comparison is a snapshot of monitored securities, so it is not a comprehensive peer study.
The filing analysis is a structured summary of the Form 8-K and earnings material, rather than a substitute for every detail in the underlying release. It supplies selected financial measures and risks, including the lower Q4 outlook and the reported foundry operating loss. It does not provide a complete bridge explaining every component of the quarterly change. Likewise, the reported price series offers daily open, high, low, close and volume observations, not intraday order-book data.
The analyst action table records firms and rating changes, but the available rows do not show each firm's complete research reasoning. A target is that firm's published estimate, not a measured outcome. The data also does not say whether analyst clients followed a rating or whether a particular trading session reflected any single report.
The next record to compare
The most concrete reference points for a later comparison are the Q4 guidance range, the $0.25 non-GAAP EPS outlook, the segment revenue figures and the October 30 close. A subsequent company results filing would allow reported Q4 performance to be compared with the outlook recorded here. Until that filing appears in the SecBot data, the guidance remains an estimate rather than a reported result.
Readers can follow subsequent filing updates and company price records on the pages linked above. SecBot's registration page provides access to the service's additional market data.