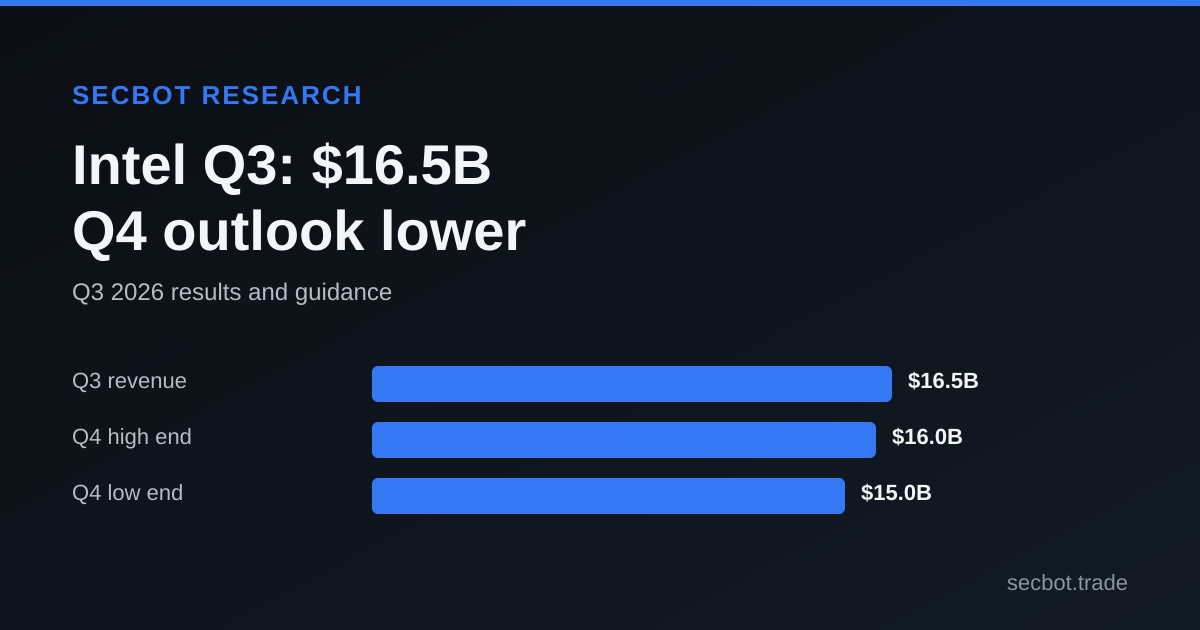
Intel reported Q3 2026 revenue of $16.5 billion and non-GAAP earnings per share of $0.52, both above the estimates recorded in SecBot's earnings analysis. The same analysis described a markedly lower Q4 outlook: revenue guidance of $15.0 billion to $16.0 billion and non-GAAP EPS guidance of $0.25. That contrast, rather than the quarterly beat alone, frames the company's latest results and the ratings activity around them.
The quarter beat estimates, narrowly on sales
Intel's 8-K filing carrying the earnings release was filed October 29, and a 10-Q appeared in the filing cache on October 30. The completed earnings analysis put Q3 revenue at $16.513 billion against an estimate of $16.490 billion. That is a $23 million difference, a narrow margin compared with the overall quarterly revenue figure. Adjusted EPS came in at $0.52 versus $0.40 expected, while GAAP EPS was $0.60. The analysis also listed prior-year GAAP EPS at $0.90.
The distinction between adjusted and GAAP measures matters here. The $0.52 figure is the non-GAAP result used in the estimate comparison. It should not be read as the same measure as the $0.60 GAAP figure. The filing analysis also described operating cash flow of $5.1 billion and adjusted free cash flow of $1.6 billion for Q3. Those cash figures offer another view of the quarter, but they do not erase the weaker outlook management gave for the next reporting period.
| Q3 and Q4 measure | Reported figure |
|---|---|
| Q3 revenue | $16.5 billion |
| Q3 non-GAAP EPS | $0.52 |
| Q3 revenue estimate | $16.49 billion |
| Q3 non-GAAP EPS estimate | $0.40 |
| Q4 revenue guidance | $15.0 billion to $16.0 billion |
| Q4 non-GAAP EPS guidance | $0.25 |
Different businesses moved in different directions
The segment figures in the completed analysis show that Intel's quarterly revenue was not moving uniformly across its businesses. The Client Computing and Physical AI Group, labeled CCPG in the filing analysis, generated $8.097 billion, down 5% year over year. Data Center and AI, labeled DCAI, generated $7.318 billion, up 78%. The report called DCAI the strongest data-center growth in 15 years, a characterization from the analysis rather than a separate forecast.
Intel Foundry revenue was listed at $6.697 billion, up 58% year over year. The same analysis reported a $1.9 billion operating loss for the foundry segment. Revenue growth and a segment operating loss can coexist, so the revenue increase by itself does not describe the segment's profitability. The report gives the figures but does not provide enough detail here to attribute the loss to a specific factor.
The All Other segment was recorded at $692 million, down 30% year over year. The listed segment amounts are presented as reported in the earnings analysis. They should not be summed as if each were a separate, non-overlapping contribution to consolidated revenue, because the available summary does not explain every consolidation or accounting adjustment.
The next-quarter outlook is the central counterweight
For Q4, Intel's stated revenue range was $15.0 billion to $16.0 billion, and its non-GAAP EPS guidance was $0.25. Against Q3 revenue of $16.5 billion and non-GAAP EPS of $0.52, those figures point to a lower sequential level. The earnings report likewise described the guidance as implying a sequential decline. The range is guidance, not a completed result, and the available records do not say where within that range the quarter will land.
The report also listed Q4 GAAP gross margin guidance of 37.1%, compared with 43.0% in Q3. It cited an expected continuation of a PC-industry slowdown through at least H1 2027 as a risk. That is the report's summary of the outlook and risk factors, not evidence that actual demand or margins have already reached those levels. The quarterly results and the next-quarter forecast therefore answer different questions: Q3 describes the period just reported, while Q4 guidance sets out management's published expectations.
Analysts reset published views after the report
Analyst records dated October 30 document several changes in the aftermath of the results. B of A Securities moved its rating from Buy to Neutral and cut its published target from $145 to $100. Citigroup maintained Buy while lowering its target from $130 to $100. TD Cowen kept Hold and lowered its target from $95 to $75. Wells Fargo maintained Equal-Weight and reduced its target from $120 to $80.
Other firms also lowered published targets without changing their recorded rating. Truist Securities maintained Hold while moving its target from $108 to $72. RBC Capital kept Sector Perform and reduced its target from $100 to $75. StoneX maintained Buy and cut its target from $140 to $100. These are firm-issued targets and ratings, not SecBot projections. They document what those firms reported at that time; they do not establish a later outcome.
The same date also brought different rating actions. KGI Securities upgraded Intel from Neutral to Outperform, while Seaport Global moved from Buy to Neutral. The batch was not a single unanimous rating call. Readers can review the local company record at Intel's stock page and the dedicated Intel analyst page.
What the available records do not settle
The filing cache confirms an 8-K earnings release and a 10-Q, while the local analysis extracts selected financial figures and risk items. It does not provide a complete explanation for the Q4 forecast, a full reconciliation of segment revenue to consolidated revenue, or a detailed account of the foundry operating loss. It also does not establish why individual analysts changed their rating or target. A target reduction is a recorded analyst action, not proof of the reasoning behind it unless the firm's accompanying research is available.
The local daily price candles provide market context but cannot answer those operating questions. They record Intel closing at $56.28 on November 6, after a $52.25 close on November 5. Those are historical closes, not a current quote, and this report does not use a quote timestamped after the available-data cutoff. The price record alone cannot identify a cause for a move.
The release and filing analysis give a clear next checkpoint without resolving the execution questions: Intel's Q4 results will test the published revenue range of $15.0 billion to $16.0 billion and non-GAAP EPS guidance of $0.25. The local earnings analysis identifies the January 2027 earnings call as the next reporting point; related company and earnings coverage is collected at SecBot earnings. For access to additional SecBot research, create an account.